

Piktochart
by Piktochart
Create infographics, reports, and slides fast with AI.
Score
Score
Our verdict
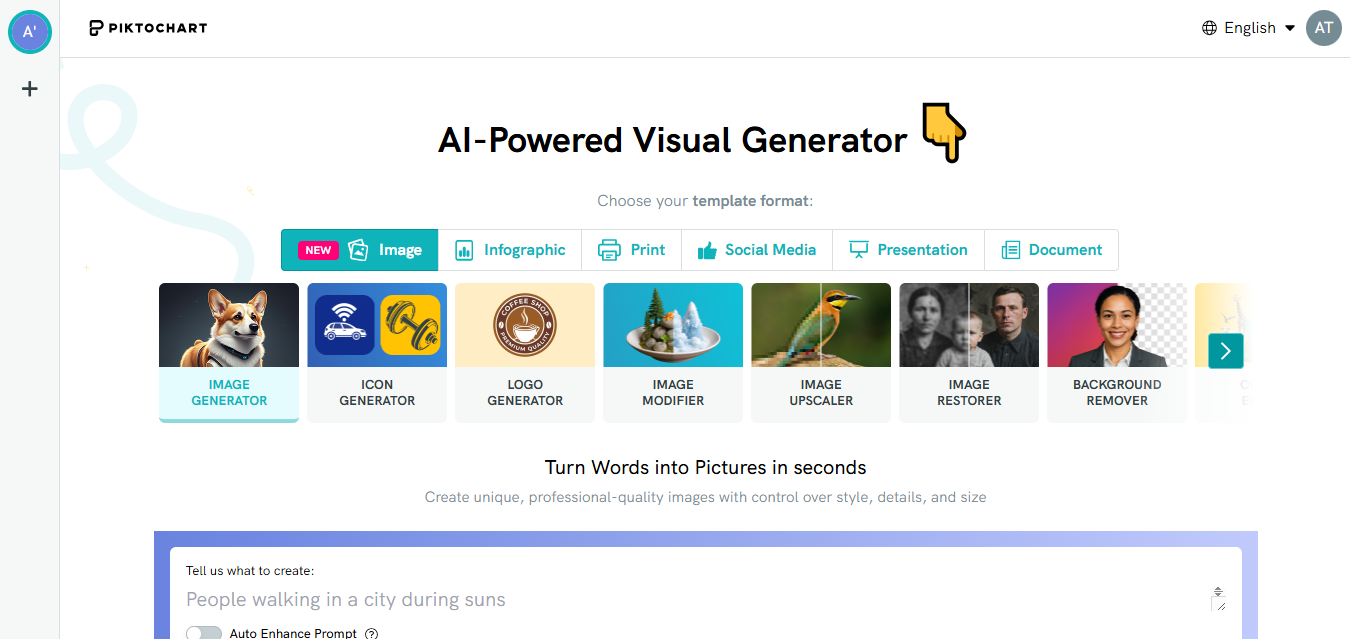
Piktochart focuses on helping non-designers create clean, professional visuals—infographics, reports, slide decks, and simple videos—quickly. In 2026 it adds AI generation across all plans via credits, which speeds up first drafts for layouts and visuals. The generous Free plan allows unlimited projects but limits you to two PNG downloads a month and 60 AI credits; the real productivity unlock starts at Pro with unlimited PNGs and a large 5M+ asset library. Business is the sweet spot for teams thanks to full brand kits, PPT/PDF exports, and 1,000 AI credits. Pricing is per member and notably cheaper on annual billing. Weaknesses include no public API and lightweight video features compared with dedicated motion tools. Still, for marketers, educators, and small teams that need polished output without a steep learning curve, Piktochart delivers strong value.
Overview
Screenshot
Score breakdown
Overall score
Scores are editorial assessments by the Compare Best AI team on a 0–10 scale.
Expert review
CBAI Editorial Team
Compare Best AI · Editorial Team
## Overview
How we tested
Days tested
7 days
Tasks evaluated
- ·Generate an infographic from a prompt using AI credits
- ·Convert a spreadsheet into a multi-chart report
- ·Build a pitch deck with brand fonts and colors
- ·Export assets to PNG, PDF, and PPT for distribution
Method
Compared against Canva and Venngage using identical inputs
Reviewer
CBAI Editorial Team
Plans & pricing
Free
- Best for giving it a try
- Get Started
- Free Includes:
- 2 PNG downloads
Pro
- Best for professionals and small teams
- per member/month
- Everything on Free, plus:
Business
- Best for teams who needs advanced brand controls
- per member/month
- Get Business
- Everything on Pro, plus:
Pricing may vary by region. Always verify on the vendor's website.
Feature comparison
| Feature | Piktochart | Canva | Venngage |
|---|---|---|---|
| Creation | |||
| AI prompt-to-visual generation | |||
| Branding | |||
| Full brand kit (colors, fonts, logos) | |||
| Export | |||
| PPT/PDF export | |||
| Assets | |||
| 5M+ premium icons/illustrations | |||
| Data | |||
| Charts and data visualization | |||
| Security | |||
| SSO/SAML (Enterprise) | |||
| Collaboration | |||
| Team collaboration/workspaces | |||
| Video | |||
| Simple video creation | |||
Is it right for you?
Good fit for
Marketing teams
Produce on-brand infographics and reports fast without needing dedicated designers.
Startup founders
Create pitch decks and one-pagers quickly using templates and AI suggestions.
Educators & students
Turn lessons and data into clean visuals; discounted plans are available.
Operations & HR
Standardize internal reports and policy visuals with brand controls on Business.
Less suited for
Advanced motion graphics
Only supports simple video; no timeline-based animation like After Effects.
Heavy data apps
Charts are approachable but not for complex BI modeling or live data feeds.
API-driven workflows
No public API advertised for automated creation or asset management.
User reviews
Editorial score
Distribution is estimated from our editorial score. Verified user reviews coming soon.
Use cases
Typical ways teams rely on this tool — from everyday tasks to specialized workflows.
- Infographics
- Reports & dashboards
- Presentations & pitch decks
- Social media visuals
Details
Category
Price
- Free $0
- Pro $15/mo
- Business $20/mo
Free version
Best for
- Marketing infographics
- Quarterly reports and dashboards
- Slide decks and one-pagers
- Social media visuals
Frequently asked questions
Piktochart
Content & Design
Ready to get started?
Visit the Piktochart website to explore plans and start your free trial.
Was this page helpful?
Compare Best AI may earn a commission when you click links on this page. This does not influence our editorial scores or recommendations. Advertiser disclosure