

Mixpanel (AI)
by Mixpanel Inc.
Product analytics that helps you understand user behavior at scale.
Score
Score
Our verdict
Mixpanel is the leading product analytics platform, tracking user events (clicks, signups, purchases) to answer questions like 'which features drive retention?' and 'where do users drop off?' AI-powered insights surface anomalies and opportunities automatically. Best for product-led growth teams. The main caveat is steeper learning curve than Google Analytics and implementation requires developer resources.
Overview
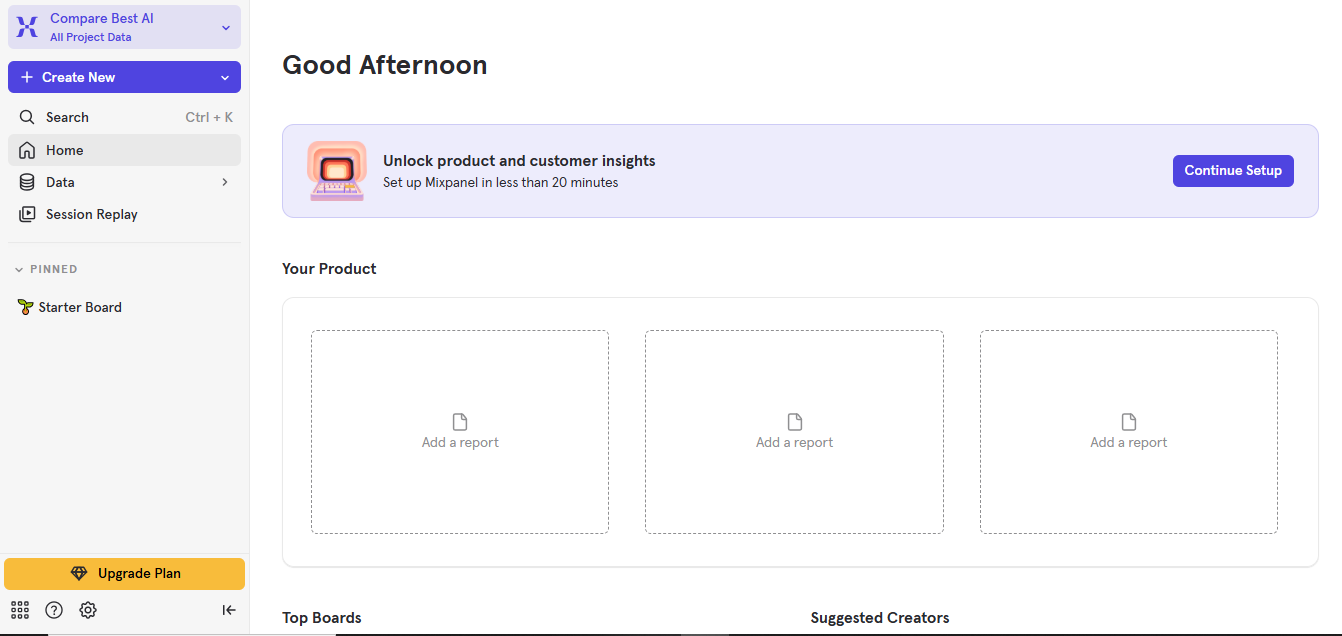
Screenshot
Score breakdown
Overall score
Scores are editorial assessments by the Compare Best AI team on a 0–10 scale.
Expert review
CBAI Editorial Team
Compare Best AI · Editorial Team
Mixpanel tracks events (user actions) rather than page views, giving product teams granular understanding of how users interact with features, complete flows, and retain over time. This event-based approach powers funnel analysis, retention charts, cohort analysis, and experimentation.
How we tested
Days tested
30 days
Tasks evaluated
- ·Event tracking accuracy
- ·Funnel analysis depth
- ·Retention chart insights
- ·Spark AI query quality
- ·Dashboard creation
- ·SDK integration
Method
Side-by-side with Amplitude on identical SaaS product analytics
Reviewer
CBAI Editorial Team
Plans & pricing
Free
- Forever
- Up to 1M events/mo
- Unlimited seats
- 10k session replays/mo
Growth
- Starts at $0; first 1M events free
- Usage calculator; volume discounts
- Example $120/mo yearly at 18M events/year
Enterprise
- Up to 1T events
- Dedicated success
- SSO/SCIM class controls
Startup program
- First year free if eligible
- Founded <5 years, up to $8M funding
Pricing may vary by region. Always verify on the vendor's website.
Feature comparison
| Feature | Mixpanel (AI) | Amplitude | Google Analytics |
|---|---|---|---|
| Analytics | |||
| Event-based tracking | |||
| Retention analysis | |||
| AI | |||
| Natural language queries (Spark) | |||
| Pricing | |||
| Free tier (20M events) | |||
Is it right for you?
Good fit for
SaaS product teams
Track feature adoption, user flows, and retention to make data-driven product decisions.
Product-led growth teams
Understand which features drive activation, engagement, and revenue.
Data teams
Warehouse connectors and group analytics serve sophisticated data operations.
Less suited for
Marketing analytics
Google Analytics handles traffic sources, campaigns, and marketing attribution better.
Non-technical teams
Implementation requires developer resources and event taxonomy planning.
Simple websites
Google Analytics is free and sufficient for basic website analytics.
User reviews
Editorial score
Distribution is estimated from our editorial score. Verified user reviews coming soon.
Use cases
Typical ways teams rely on this tool — from everyday tasks to specialized workflows.
- Funnels
- Session replay
- Feature flags
Integrations
Reported connectors
Apps and services commonly connected out of the box or via official connectors.
- Segment
- Snowflake
- BigQuery
- AWS
- Amplitude (migration)
- Zapier
- Slack
- Jira
- Custom SDKs
Privacy & compliance
Security & data practices
Highlights we track from the vendor's documentation. Always confirm current terms, subprocessors, and regional policies on their official site.
- SOC 2
- GDPR-ready
- SSO/SAML
Details
Category
Price
- Free forever: 1M events/mo, unlimited seats, 10k session replays. Growth starts at $0 (first 1M events free
- calculator example $120/mo yearly vs $140 monthly at 18M events/year). Enterprise custom. Startups <5 years, ≤$8M funding: first year free on Startup Plan. No card on Free
Free version
Best for
- Product teams (Free 1M events
- Growth usage-based from $0)
Frequently asked questions
Mixpanel (AI)
Marketing
Ready to get started?
Visit the Mixpanel (AI) website to explore plans and start your free trial.
Was this page helpful?
Compare Best AI may earn a commission when you click links on this page. This does not influence our editorial scores or recommendations. Advertiser disclosure